Financial Highlights
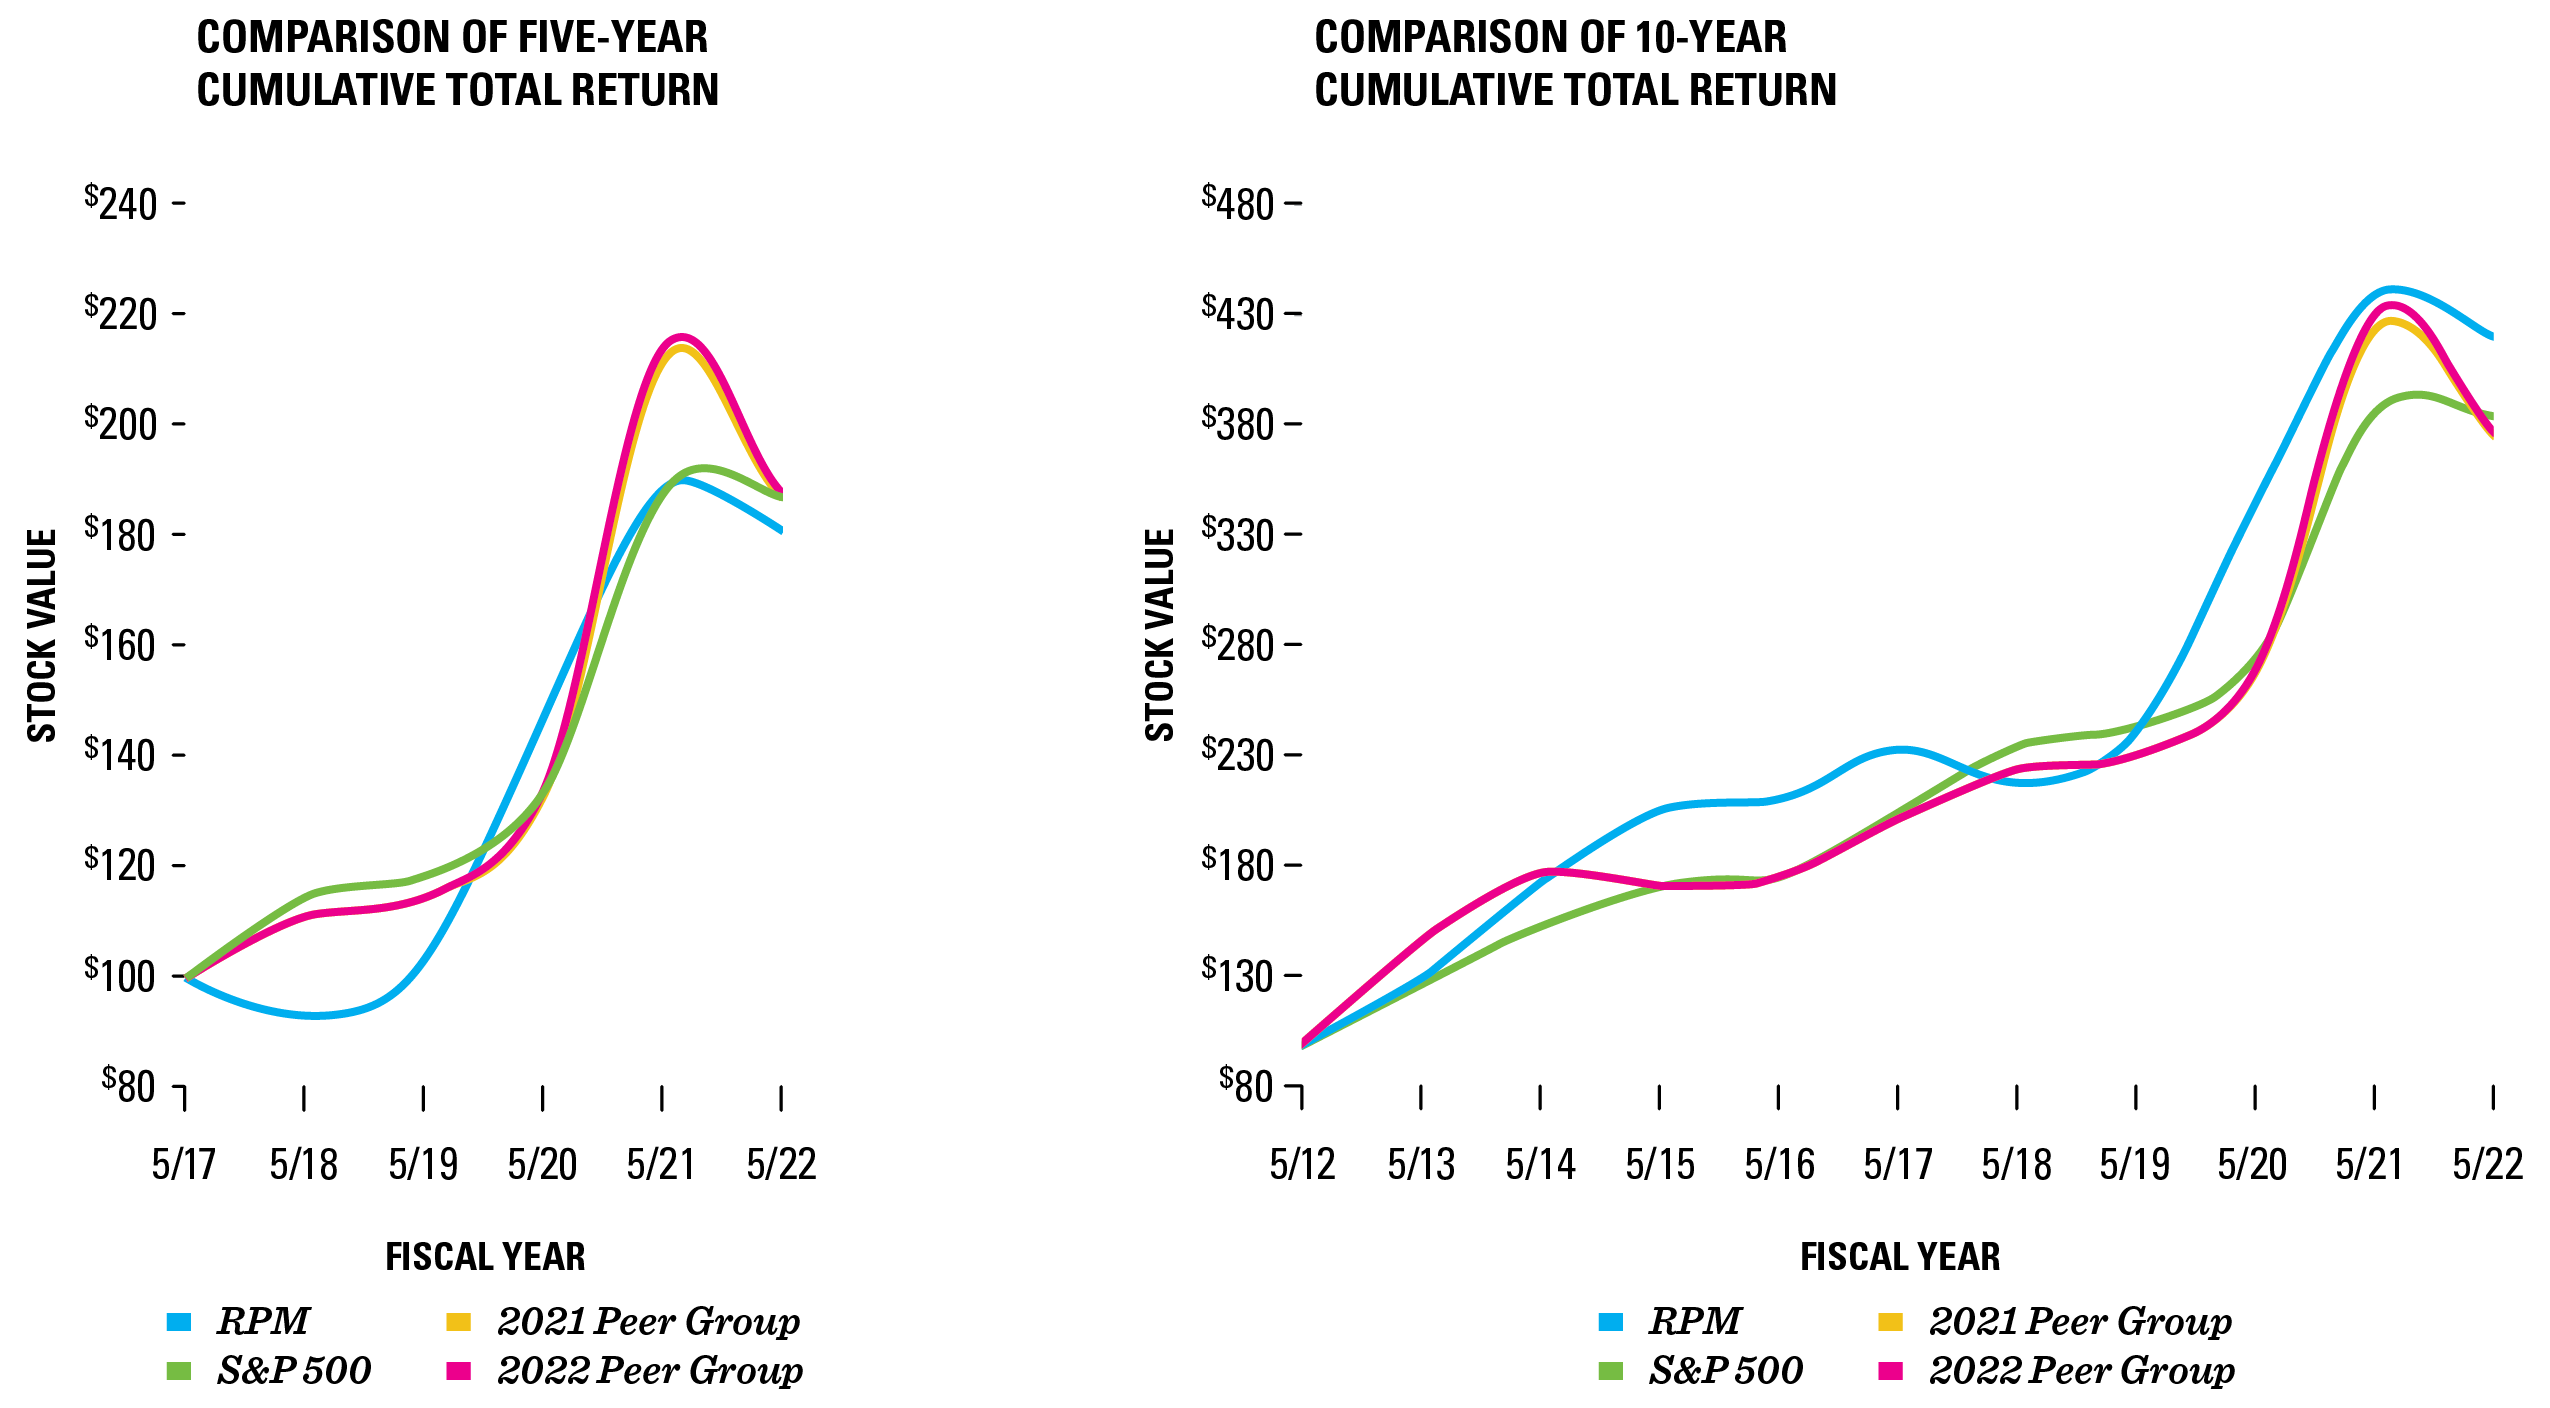
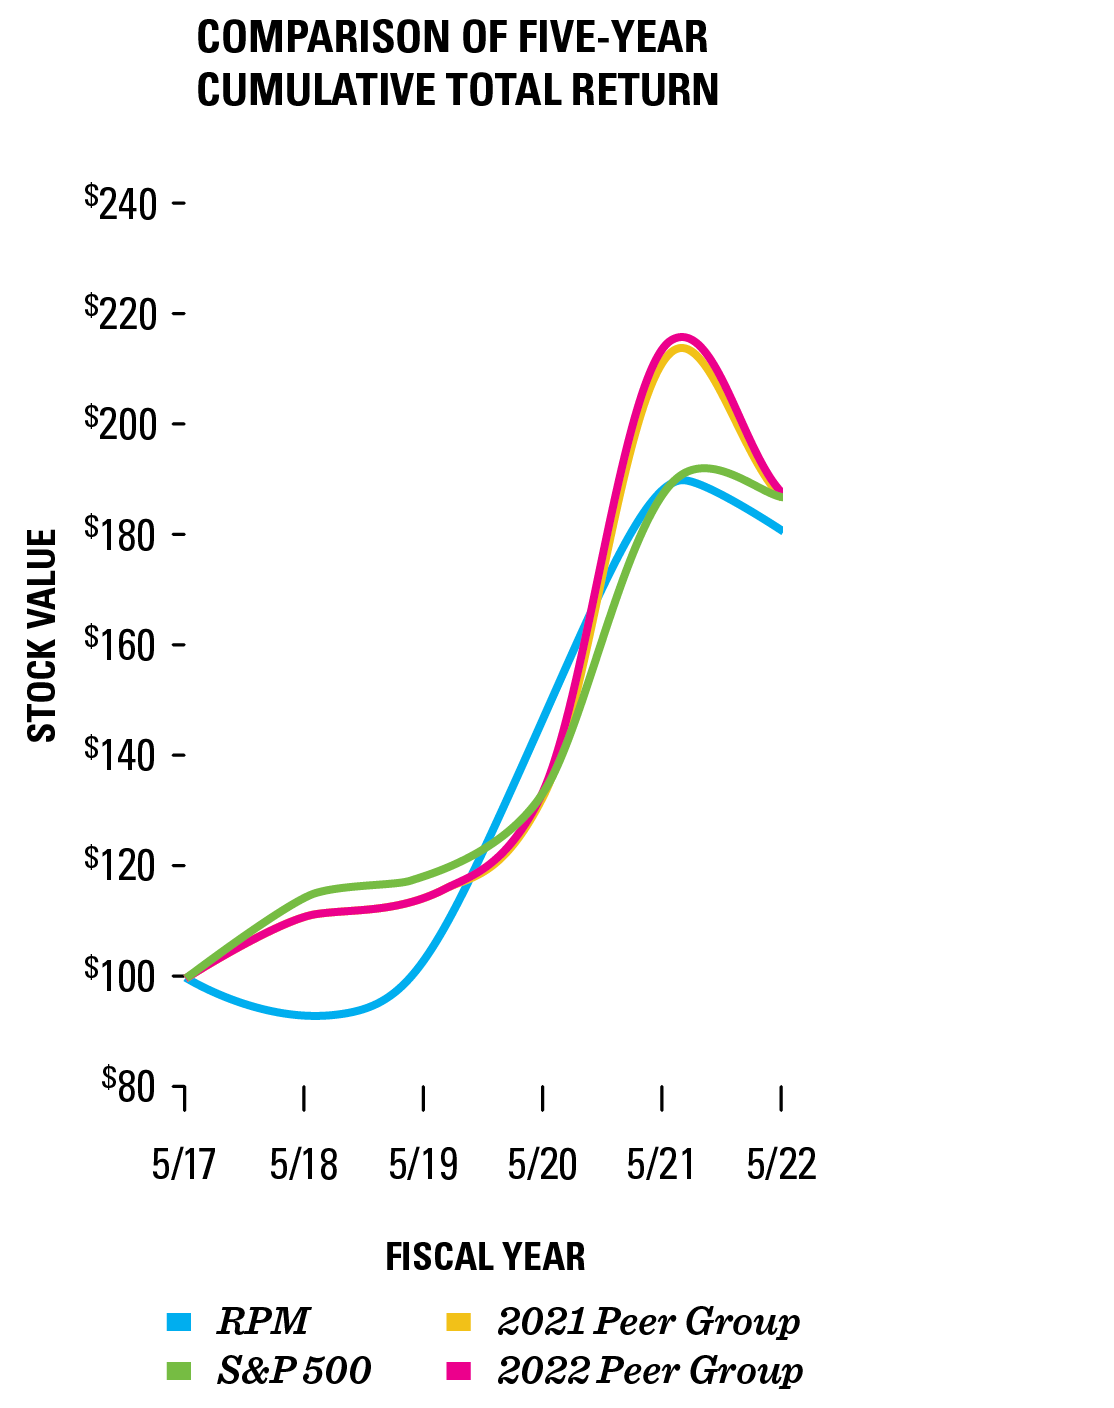
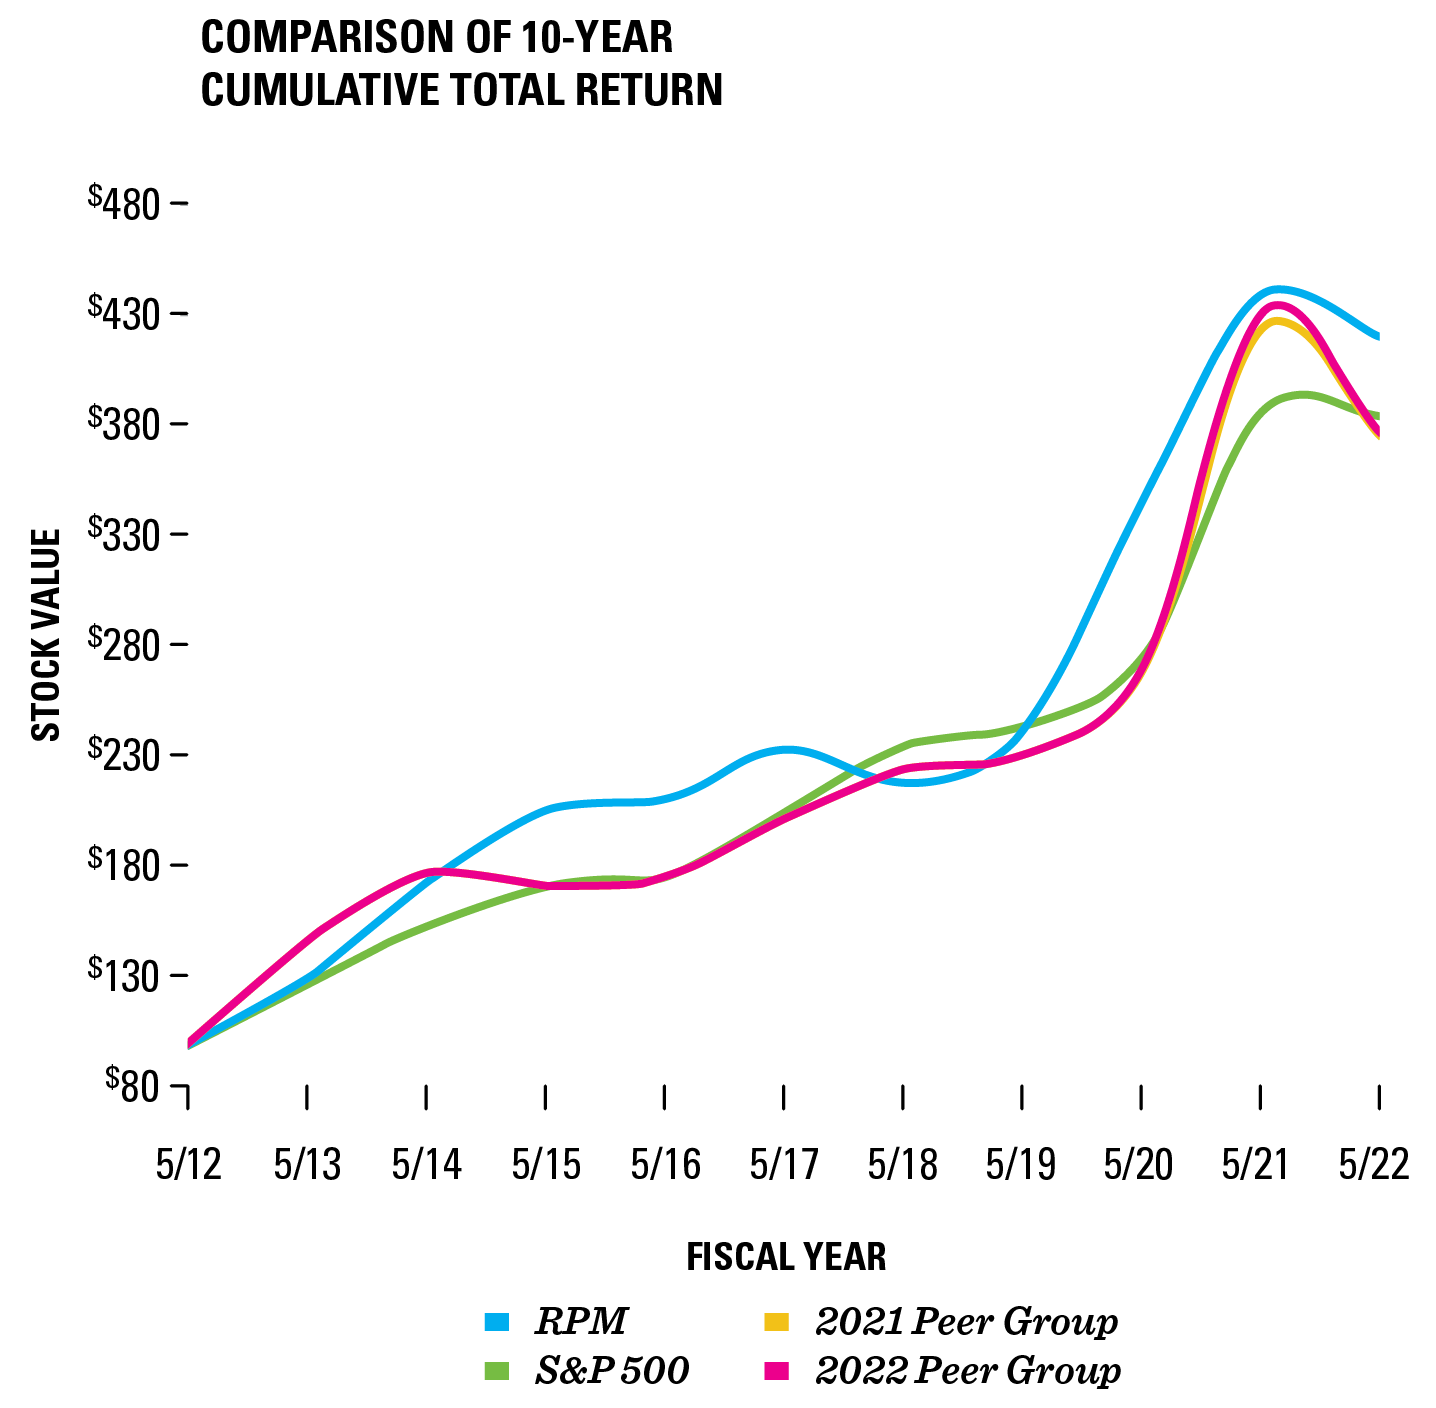
The graphs above compare the cumulative five- and 10-year total return provided to shareholders on RPM International Inc.’s common stock relative to the cumulative total returns of the S&P 500 Index and two customized peer groups. An investment of $100 (with reinvestment of all dividends) is assumed to have been made in RPM common stock, the peer groups, and the index on 5/31/2012 and 5/31/2017 and their relative performance is tracked through 5/31/2022. Peer Group companies include: Akzo Nobel N.V., Axalta Coating Systems Ltd., Carlisle Companies Inc., GCP Applied Technologies Inc. (excluded from 2022 Peer Group), H.B. Fuller Company, Masco Corporation, PPG Industries, Inc., The Sherwin-Williams Company and Sika AG.
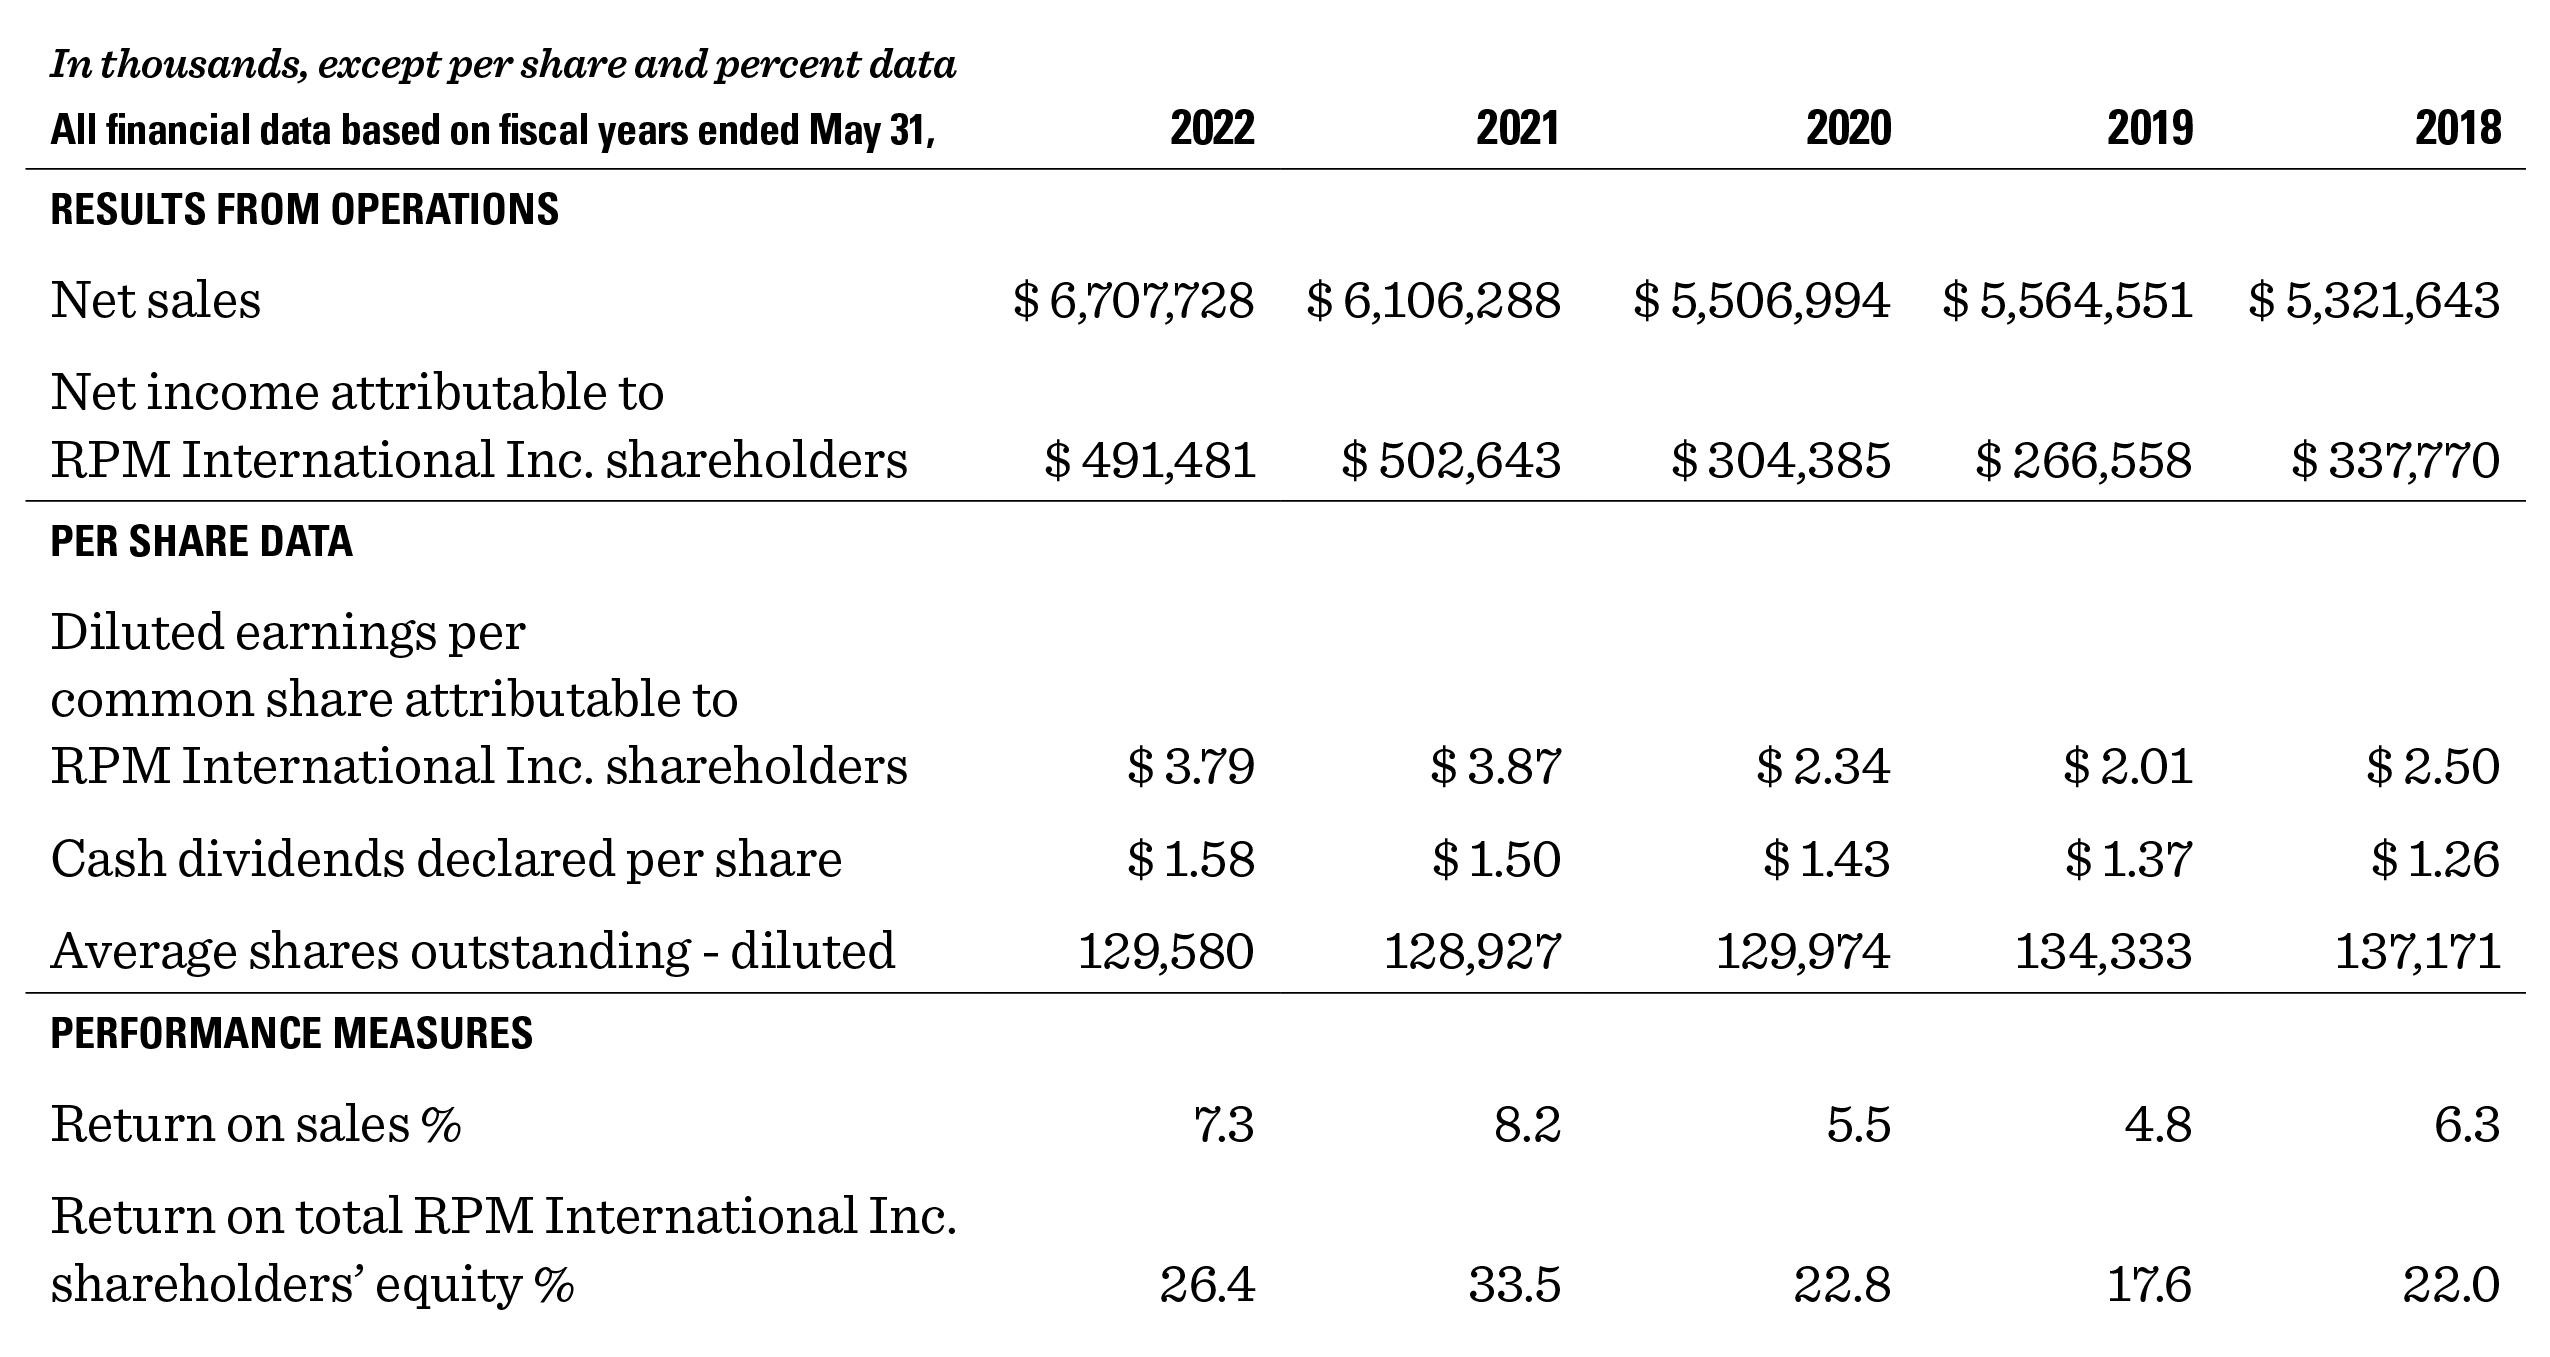
Financial Data Footnotes
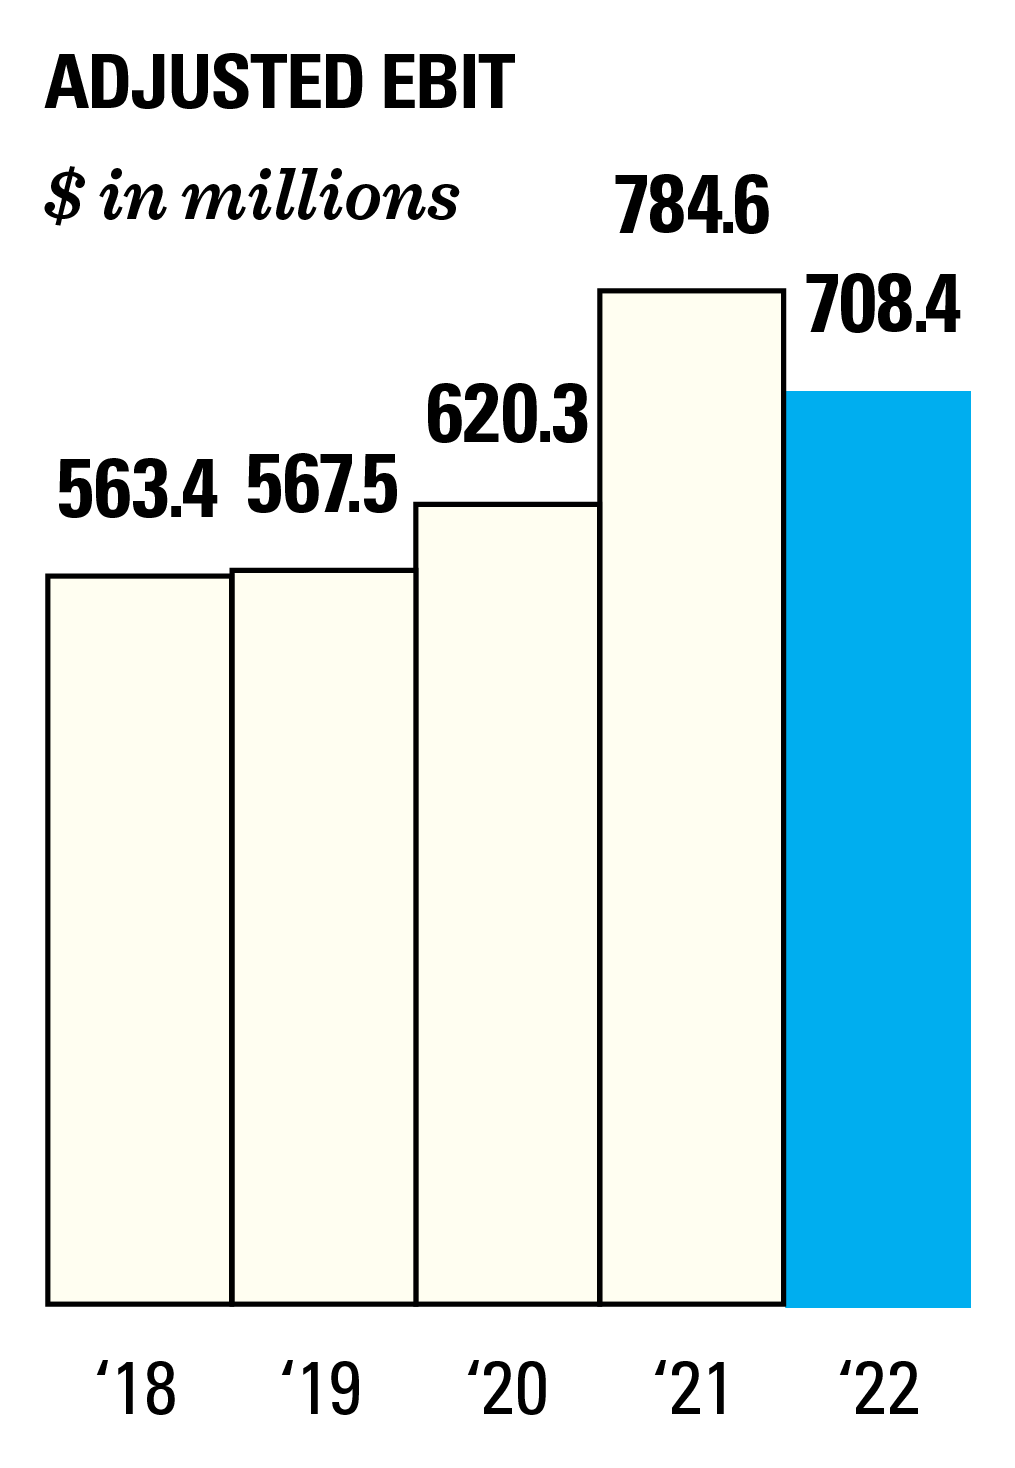
Adjusted EBIT excludes restructuring charges and other items not indicative of ongoing operations of $6.1 million, $75.2 million, $121.3 million, $126.0 million and $62.2 million in Fiscal 2022, Fiscal 2021, Fiscal 2020, Fiscal 2019 and Fiscal 2018, respectively. EBIT and Adjusted EBIT are non-GAAP financial measures. See our Annual Report on Form 10-K accompanying this report and our Current Reports on Form 8-K for more information.